Last week was a busy and interesting period in the Texas electricity market. First, the PUC filed a motion (for a meeting that happened on 6/28) to vote whether or not to approve the raising of the market cap to $4500, up from $3000. Then ERCOT started releasing information that while people should conserve energy in the early parts of this week, they were prepared to handle the load and generation without reaching an emergency situation. Then numerous REPs (Retail Electricity Providers) started raising their prices, seemingly all at once. That’s a lot of big things happening at once, so I looked around at things a little more closely, and what I’ve noticed is interesting.
For starters, people should remember that ERCOT sets forecasting models on expected usage both months in advance, as well as the day before, and these things shape the cost of what energy will be traded for on the market. We’ll ignore the forecasting from months out for now and focus on the day before forecasting for the moment because that’s what interests us immediately.
Monday June 25th, 2012
On Sunday June 24th, ERCOT released their Day Ahead forecasting for Monday, June 25th. ERCOT typically releases these numbers between 2-2:30 p.m. Sunday’s forecasts of Mondays usage looked high but normal. Along with the release of day ahead forecasting, each day ERCOT also releases how the Day Ahead Market (DAM) cleared. This gives an indication of how prices look on the wholesale side of the business, which settles in a Dutch Auction format. Sunday’s DAM settled very high at $125, but that alone wasn’t surprising given the high expected load and nervousness from last August. While $125 is very high, it’s also a function of the load simply getting more expensive as the supply boundaries are peaked…in other words, basic supply and demand.
Then, Monday, June 25th arrives and the day ends up being one of the hottest June temperatures on record. It’s hot, and the grid is taxed, using almost 66,000 megawatts of energy. That being said, everything still behaves perfectly normal. The forecast models predicted a high usage day, it was a high usage day, and the usage matched the forecasts fairly closely. Also, the pricing on the spot market actually settled like a standard summer day around $36/mWh (megawatt per hour), despite the DAM pricing at a high $125 per mWh.
One interesting thing did happen on Monday, however. Instead of releasing their Day Ahead forecasting by 2:30 p.m., ERCOT uncharacteristically didn’t release it until roughly 8 p.m. Monday night, and they appear to have offered no explanation whatsoever for the delay. When I asked Dan Jones, the Independent Market Monitor for ERCOT about the delay in releasing the DAMs and if there were any reason for the delay, he couldn’t provide a meaningful response. He simply said, “Sometimes that kind of thing happens.” And to be clear, “That Kind of Thing” in this instance is actually a violation of ERCOT’s own protocols for the procedure when the DAM is going to be late. When the information finally was released, the forecasting for Tuesday, June 26th predicted an extremely heavy load.
Several things are unusual about the close on 6/25. Obviously the fact that it settled about 6 hours late is strange. I’m not sure an event has occurred in which the DAM closed as late as it did on 6/25. More strange still is that no one has really offered an explanation with any data as to why this delay happened. Was it operational? Was it technological? Even the Independent Market Monitor doesn’t seem to know or care enough to explain. Finally, when the DAM did settle for the day and was released, it closed at double the price of the prior day at $250. And it closed with no reason for anything to cause such a dramatic jump from a bidding perspective given that bids are done at 10 a.m., long before peaks are seen in the day prior.
Tuesday June 26th, 2012
Tuesday comes around, and sure enough, it ends up being one of the heaviest days on record for June in terms of load and usage. There were also price spikes, where the spot market prices shoot up to $3000 per unit (instead of the usual $30-$40 range) because of the scarcity of electricity on the grid. It’s important to note that these kind of price spikes impact the forward price curve for power and are being used to encourage new generation plants to be built when the PUC voted to raise the market cap to $4500. The timing is interesting that one of these price spikes happened just before the PUC voted to raise the price cap.
Another interesting thing is that around 5 p.m. on the evening of June 26th an extra 700-1000 megawatts of energy came on the grid and drove prices back down to normal levels…after the emergency price of power took place for several hours. That’s interesting timing. When I spoke with Dan Jones about this, he responded with the following:
“I can’t talk about specific units, but I did share with some other people who had questions that there were some units that had trouble in the afternoon but were able to resolve those issues right around the 5 p.m. time frame. If those units had been fine, there would have been help sooner.”
Now lets take a look at things more closely. Monday is an extremely high day in terms of load. The Day Ahead Forecasting is released 6 hours later than usual with no explanation as to why. When the DAM is finally released, it reflects settled prices at double Monday for Tuesday. Tuesday comes around, and despite a very heavy forecast, the grid struggles to generate enough electricity to meet demand, and a price spike happens, driving up costs for REPs (Retail Electricity Providers) such as Stream Energy, some of which will be passed on to consumers and businesses. Late in the day, an extra 700-1000 megawatts of power find their way onto the grid, after the emergency has passed, and drives prices back down to normal levels.
If ERCOT had forecast a heavy usage day for June 26th, and they HAD the generation to bring more plants and power online, then why did it take so long in the day to happen? Why did they wait until 5 p.m., after the crisis was over, to bring this power online? If they knew they would need it from their forecast models, then why wasn’t it ready earlier in the day, when it was actually needed? Dan Jones says it was due to plants being down or delayed. What is strange is that ERCOT’s own press conference the following morning referenced no major outages and plenty of reserves being ready had usage gone higher. So why not have that power deployed sooner and prevent a price spike? Jones’s position that plants were down and ERCOT’s rosy take the following morning are in direct contradiction to one another.
Let’s look at some visual aids, which make this situation look a little more alarming.
Load Forecast vs Actual Usage
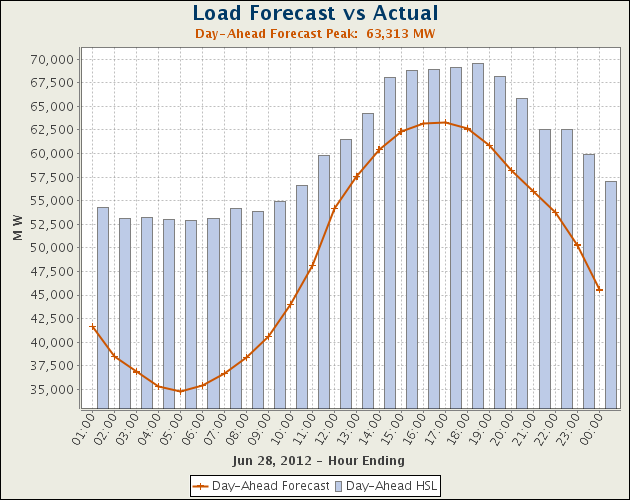
Below is a graph of just a Load Forecast. This is the graph that is typically released at 2:30 p.m. every day to REPs, energy traders, banks, etc. Anyone who does any trading on the market. A chart like this was released on Monday at 8 p.m. (instead of 2:30 p.m.), forecasting the expected usage of electricity on the grid. The orange line represents the expected usage, and the bars represent the amount of generation expected to be online to meet the usage demand, called HSL (Hourly Scheduled Load). This is an example, and it is a forecast for a normal day, June 28th, 2012.

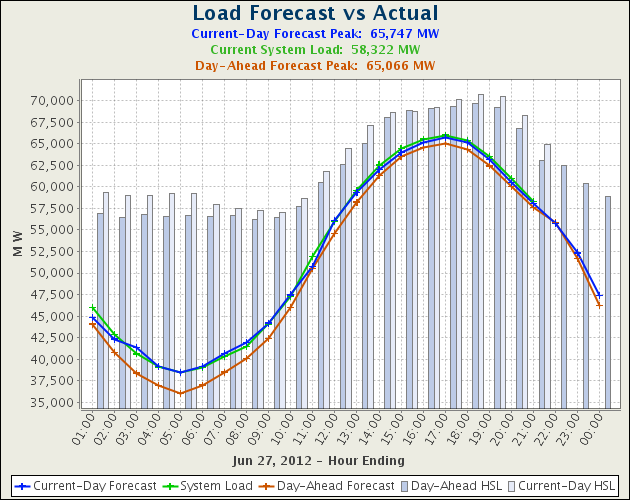
Now let’s take a look at a chart called Load Forecast vs. Actual Usage. This chart is a combination of the forecast chart above and the actual usage, as well as an additional forecast for the same day, the actual load on the grid, and the actual HSL, broken down by hours.

This chart is for Wednesday, June 27th, which I would classify as a high normal day. It was high usage, but there was no shortage and no price spikes The green line represents the actual load, the orange line was the forecast usage from the previous day. Additionally, we have an extra bar on this graph which is the actual HSL to go along with the forecast HSL from the previous day which we saw in the 1st graph.
Now let’s look at this graph closely. Look how closely both forecasts match with the actual usage of the green line. Additionally, look at how closely the forecasts for the hourly set load match the actual generation assets scheduled to bring load to the grid. That’s pretty precise, right? This is what the Load Forecast vs. Actual Usage graphs look like almost every single day of the year. ERCOT is pretty good at their forecasts and meeting demand.
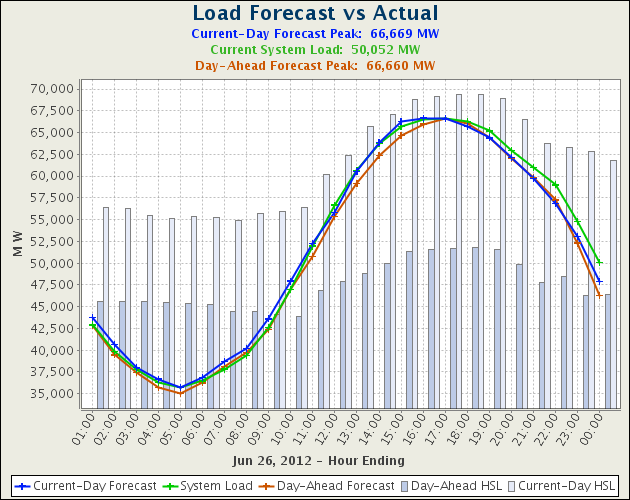
Now let’s take a look at the Load Forecast vs. Actual Usage graph from Tuesday, June 26th, the day where there were price spikes because of demand, and the day after ERCOT was inexplicably late on releasing their Day Ahead forecasts:

Notice anything different? I do. What immediately jumps out to me is the Day Ahead HSL that was released on Monday in conjunction with the orange line of the Day Ahead forecast. Despite the forecast line soaring over 60,000 megawatts of usage during peak hours, on a day where the largest metropolitan areas all over the state were expecting temperatures well over 100 degrees, ERCOT had only scheduled generation around the 50,000 megawatts of generation mark. Why is that? Why would that ever happen? Despite correctly forecasting the required usage the day before, ERCOT was only scheduling enough load generation to meet roughly two-thirds of the state’s power needs. And unsurprisingly, the hours where there wasn’t enough scheduled demand in advance are the peak hours where prices spiked. Additionally, let’s not forget that Monday, June 25th was ALSO a very heavy load demand day, using approximately 66,000 megawatts of energy, so it isn’t as if the expected amount of generation resources just snuck up on anyone, because Monday, Tuesday, and Wednesday were all actually very similar days in terms of total usage.
There are several explanations for Tuesday’s graph. One is that the graph is wrong. That would be another coincidence on a day of coincidences. Another reason would be scheduling incompetence. That answer is unlikely, given ERCOT’s usually excellent work in this arena, but perhaps Tuesday’s DAM forecasting work was done by a trained monkey on his first day on the job. I would take that answer over the final possibility, however, which is that a generator was “withholding supply.” “Withholding” is exactly what you’d think, that generators were choosing not to bid in supply in an effort to have prices drive higher, or “spike,” only then to bring their power onto the grid. That is an extremely dangerous problem for any grid. It’s also illegal, and a perfect example of market manipulation. When I asked Dan Jones about this possibility, he responded by telling me that while he understood how anyone looking at the aggregate data provided by ERCOT could see that as a possibility, it is impossible to draw a conclusion if you’re just using aggregate data. So he is stating that he has information we do not in what is ostensibly a transparent market. When I asked him how often he and his team convene to look at suspicious behavior, and if they would be taking a look at what happened on Tuesday, June 26th, he said there was “no set time” and they wouldn’t likely take a closer look unless some additional compelling information surfaced down the line. Succinctly, the Independent Market Monitor is saying that he doesn’t know exactly what happened Tuesday and he doesn’t have any immediate plans to take a closer look. I’ll be interested to see what he ultimately does, in any event. My question would be that, as the Independent Market Monitor, if Jones isn’t going to look at the possibility of manipulation when spikes cause emergency pricing to set in, then when does his team look into things? What does trigger a market investigation if not emergency pricing on a day that was accurately forecast and a day where ERCOT later claimed that they had more than enough generating resources available?
To sum this section up, ERCOT, an organization that has a history of being almost preternaturally precise with their forecasting and management of the load on the grid, is late releasing their Day Ahead forecasting for Tuesday, June 26th, a day that is expected to be one of the hottest on record and will strain the grid. Inexplicably, despite the high temperatures and ERCOT’s own forecast models, the amount of load they scheduled during peak hours was well below the grid’s needs. And if there was reserve power was available, as ERCOT claimed in their press conference on 6/28, why did it take so long to bring it online? Why were ERCOT’s HSLs so low, well under their own forecast needs? Because on the surface it appears as though a generator or generators didn’t schedule in for Tuesday the 26th in a manner which they would be expected to do so.
Is Manipulation Possible?
I’m not the only person who has noticed this strange behavior. I mentioned at the top of the article that many REPs such as Cirro Energy started raising their rates substantially this week, right around the time this strange market behavior happened on Tuesday. I spoke with Dan Jones on this issue too, and he said others had asked similar questions. I guess many people would also like some answers. It appears that the Houston Chronicle’s Loren Steffy saw or heard some related concerns in the Spring and Dan Jones had similar answers as well. From Steffy’s May 19th article Electricity Prices are Going Up – Just Ask Alice:
“Even before the cap is raised, though, traders tell me they’re seeing suspicious activity in the spot markets.
It’s not clear what’s causing the latest spikes, but Dan Jones, the state’s independent market monitor, agreed that the spot markets are behaving differently.
Jones said he hasn’t ruled out manipulation, but he’s still investigating.
To be clear, this also isn’t tinfoil hat conspiracy stuff. ERCOT has been manipulated before. There were lawsuits settled in 2005 in which Luminant was accused of creating scarcity spikes in the marketplace. Luminant paid 15 million dollars (the original fine sought by regulators was 210 million) and admitted no wrongdoing. This is also the exact same kind of behavior that created the power crisis in California in 2000 that killed that deregulated market entirely and offered the detestable transcripts of traders at Enron and elsewhere laughing as they helped spur rolling blackouts.
Conclusions
So is the grid being manipulated, or is this all coincidence, if you believe in coincidences? If it IS manipulation, then who might be responsible? The most likely explanation would be a generator or group of generators working to create artificial scarcity, boost profits and push across these big numbers by withholding generation. It is unlikely ERCOT is involved as well, although ERCOT would love to see more generation units built in Texas and profitable days like June 26th supposedly draw interest in investment. And let’s not forget the coincidence that on June 28th the PUC voted to approve an increase in the market cap from $3000 to $4500, which would have made Tuesday an even MORE profitable day for any online generators under the new rules.
As for why this matters to Texans, well, the electricity rates are going up with this strange market behavior. And why wouldn’t they? Markets rely on some sense of propriety and predictability. It should surprise no one that bid/ask spreads on forwarding power curves on the InterContinental Exchange (ICE) market have widened by as much as $90 for certain periods. That’s a good indicator that participants don’t really understand what’s coming next either. You can be certain that that will lead to further upward retail price activity.
